Rainfall and Lake Levels
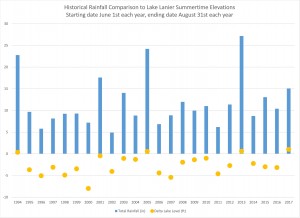
There has been a great deal of discussion this summer about rainfall and lake levels. In response to those discussions, the LLA did some research and found the daily rainfall numbers for a 24 year span of 1994-2017 at the Gainesville, GA gauge. (1994 was the year that gauge was installed by the weather analysis people at the University of Georgia where we got the data from.) We pulled out the daily rainfall numbers from June 1 through August 31 for all 24 of those years. Then, we pulled the starting and ending summertime lake level elevations for those same years, calculated the delta, and charted the trend lines out.
It is interesting to look at 2017 specifically because, while we had only slightly higher than average rainfall over the summer season this year – 15 inches for summer 2017 compared to a 24 year historical summer average of 12 inches – we had a significantly better than average delta lake level over the summer in 2017 – delta positive 12 inches for summer 2017 compared to an average historical delta of negative 31 inches. Part of the reason for this is since we started the summer season in 2017 at a lower lake level, we spent more time in the Zone 4 action level with the two hour surge blocks of hydropower releases suspended. The result is that in 2017, we actually show a more positive impact on lake level over the summertime than we have experienced in years with more significant rain. In other words, we got more “bang for our buck” with rainfall in 2017 than we did in 1994, 2005 or 2013 – because we started at a lower lake level and hit Zone 4 in 2017. Additionally, good rainfall downstream of us in summer 2017 helped reduce the pull on releases out of Lake Lanier. In 1994, 2005 and 2013, we were closer to or even above full pool so the Corps might have been releasing more those years as well to bring us back down to full pool.
2001 is interesting because it doesn’t follow that trend and highlights what we all know – that lake levels are not directly correlated to rainfall in the area. There are a lot of other factors at play that are not easily simplified down to a single bar chart representation. For example, average temperatures during this same period of time would impact this as well, because it would increase or decrease the amount of surface evaporation depending on if we have a warmer or cooler average summer temperature. Of course, what is happening downstream of us also greatly impacts releases on Lake Lanier. Also, keep in mind, even if the outflows at Buford Dam are at a minimum level, any rain amounts flowing into Lake Lanier will need to offset the net amount of water withdrawn by the municipalities around the lake for drinking water purposes – City of Cumming, City of Gainesville and Gwinnett County – before we would see an increase in lake level.
If anyone has interest in seeing the detailed numbers behind this analysis, please email us with your request at lakeinfo@lakelanier.org and we will send it over.